Page Profiler
If your ThinkUp installation’s pages are slow to load, you can enable the page profiler to help diagnose the problem.
What the Page Profiler Shows You
When the page profiler is enabled, at the bottom of every ThinkUp application web page, you’ll see how long it took your web server to generate the page, followed by a list of all the database queries that ran in it and how many rows they returned, how long each query took to complete, which class and method executed each query, and how long the PHP took to generate the page and whether or not it was loaded from cache. The log lists actions slowest to fastest (execution time descending).
Here’s a screenshot of what the profiler output looks like on the ThinkUp Dashboard:
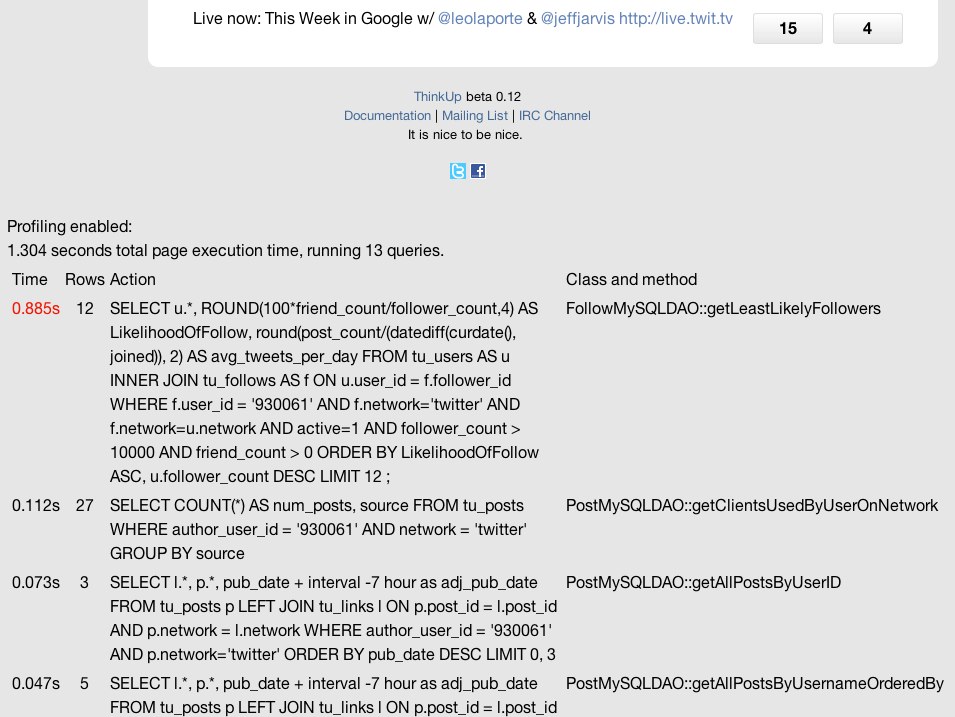
Particularly slow database queries (those which take 0.5 seconds or more to complete) have their execution time highlighted in red.
How to Turn on the Page Profiler During Development
To enable the page profiler on your installation, in ThinkUp’s config.inc.php file, set:
$THINKUP_CFG['enable_profiler'] = true;
This value is set to false by default.
The page profile is meant for development purposes only.
Warning
Do not enable the page profiler on a ThinkUp installation that’s on the public internet. It exposes internal ThinkUp queries and parameters, and could pose a security risk.